Welcome to my Analytics/Data Science Portfolio. I am passionate about innovation and leveraging data analytics, data science, and machine learning to help businesses make informed decisions. Below are summaries of a few projects that I have recently completed. Click the project header links below in blue to explore all of the project’s details, including code, additional visualizations, and interpretations.
Project 1: Linear Regression
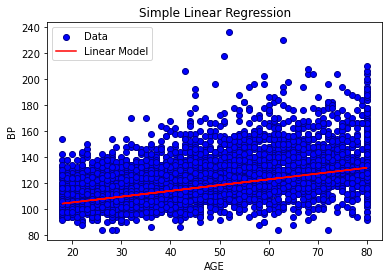
This analysis includes both simple linear regression and multiple linear regression. The simple linear regression model examines the relationship between age and blood pressure and finds that age is a statistically significant predictor of blood pressure with a moderate correlation of 0.46 and a p-value <0.001. This means that for every one-year increase in age, systolic BP increases by 0.44 units on average. The R-squared value for the model is 0.23, indicating that 23% of the variation in systolic BP can be explained by age.
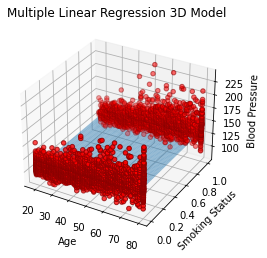
The multiple linear regression model includes three predictors: age, smoking status, and BMI, and was used to explain the variation in blood pressure. For every one-year increase in age, blood pressure increases by 0.43 units on average; smokers have blood pressure that is 1.21 units higher on average than non-smokers; and for every one-unit increase in BMI, blood pressure increases by 0.26 units on average. Overall, these findings suggest that age, smoking status, and BMI are all significant predictors of blood pressure and that controlling for all three predictors can explain 24% of the variation in blood pressure.
Project 2: Logistic Regression
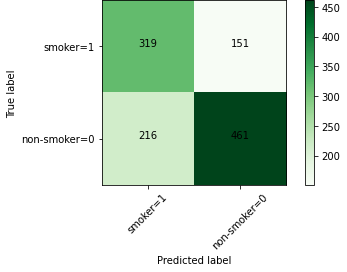
A binary logistic regression model was developed to predict the smoking status of adult survey respondents based on 20 health-related predictor variables. The model’s performance was evaluated and found to have an average accuracy (F1-score) of 68% with a good discriminatory ability (area under the ROC curve of 0.75). The model was able to correctly predict 319 cases of ‘smoker’ and 461 cases of ‘nonsmoker’, but also misclassified a certain number of cases. The model’s performance is not perfect and further exploration of the data and other models that work better with unbalanced datasets is recommended.
Confusion Matrix
Project 3: Comparing Classification Models
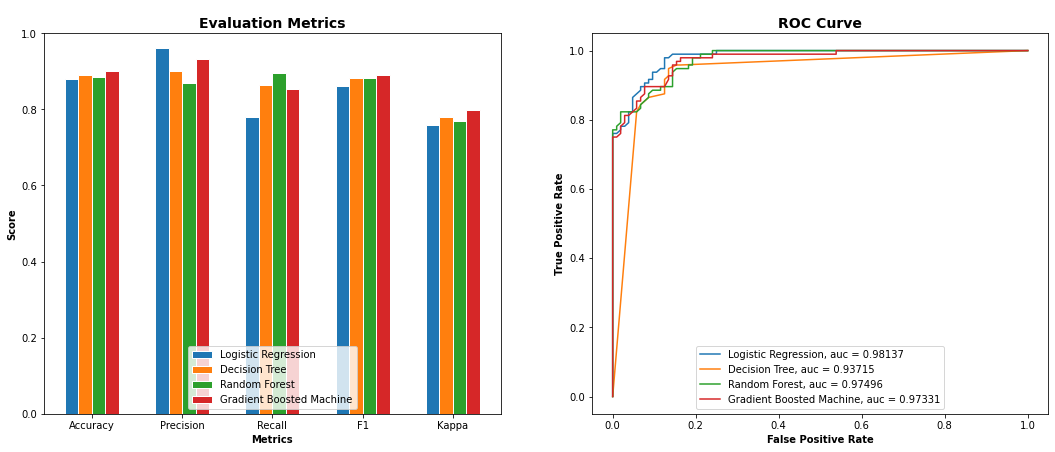
This project compares and evaluates the performance of multiple binary classification models on their ability to predict the registration status of medical providers (registered or unregistered). The goal of this analysis is to understand the association between a provider’s registration status and their demographic, geographic, communication, and behavioral characteristics. Four classification algorithms were built and trained to predict the provider registration status, and the performance of each model was evaluated based on six key accuracy metrics. After comparing all 4 models, the Gradient Boosting Machine (GBM) was found to be the best-performing model with the highest degree of accuracy (90%). The sanction count and location count were discovered to be the two most important features. The model can be further enhanced to produce better results by tuning hyperparameters, comparing different classifiers, or incorporating additional data.
Model Performance: Comparison of 4 Classification Models
Project 4: Anomaly Detection
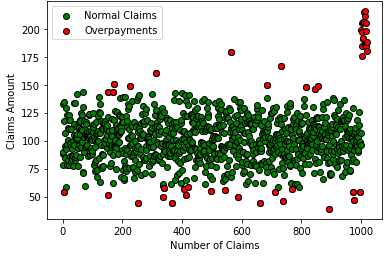
This analysis used an Isolation Forest machine learning algorithm to identify overpayments in a synthetic claims data set. It works by randomly isolating points in the data and building decision trees to decide whether a point is an anomaly or not. The Isolation Forest model was trained with a contamination rate of 0.05, meaning that it was designed to identify claims that were different from normal claims by 5%. The predictions from the model were used to filter the dataframe and only overpayments were returned. The model identified 51 claims that could be considered overpayments and require further investigation to validate its results. The results of this analysis demonstrate the effectiveness of the Isolation Forest algorithm in accurately identifying potential overpayments in a claims dataset.
Potential Healthcare Claims Overpayments
Project 5: Data Visualization
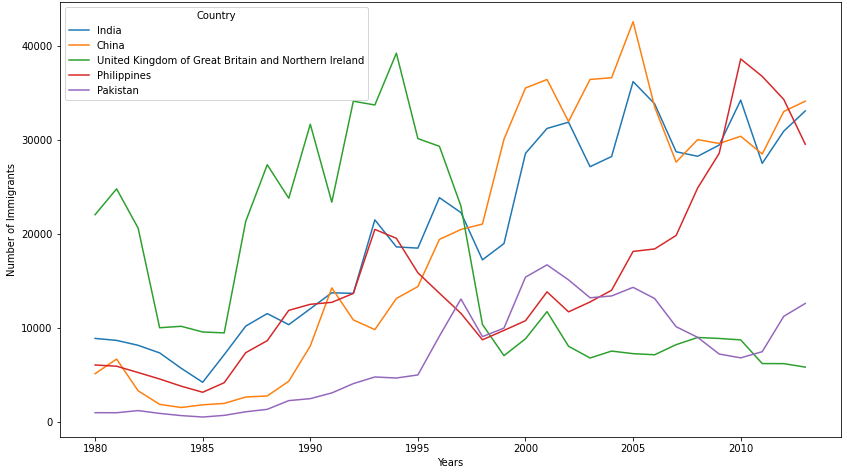
This project utilizes Python to generate data visualizations on data extracted from the web. By using visual elements like charts, graphs, and maps, data visualization tools provide an accessible way to visualize trends, and patterns in data. The datasets explored in this project included immigration data from the United Nation’s website and vacation rental data from the city of New Orleans’ website. This project outlines the use of the following visualizations to explore data trends and insights, line plots, area plots, histograms, bar charts, pie charts, box plots, scatter plots, bubble plots, and maps.
Immigration Trends of Top 5 Countries